GWSDAT
GWSDAT v3.2 now released!
Click here for a list of important updates.
What is GWSDAT?
GWSDAT is an open source, user-friendly, software application for the visualisation and interpretation of groundwater monitoring data. It also enables to work with other types of monitoring data collected over time and space (e.g. soil gas concentrations).
Key functionalities of tool:
- Trend analyses
- Data smoothing
- Spatiotemporal smoothing
- Determination of contamination plume characteristics
- Well redundancy analysis
- Automatic report generation tools based on user input.
Business Benefits
GWSDAT, through improved risk-based decision making and response, adds value in several different ways:
- Early identification of increasing trends or off-site migration.
- Evaluation of groundwater monitoring trends over time and space (i.e., holistic plume evaluation).
- Nonparametric statistical and uncertainty analyses to assess highly variable groundwater data.
- Reduction in the number of sites in long-term monitoring or active remediation through simple, visual demonstrations of groundwater data and trends.
- More efficient evaluation and reporting of groundwater monitoring trends via simple, standardised plots and tables created at the ‘click of a mouse.’
- Well Redundancy Analysis functionality to identify potential optimization measures with regards to monitoring well network sampling locations.
GWSDAT V3.2 updates
- Well Influence Analysis: Building on the existing well redundancy analysis feature, GWSDAT now provides an ordered well omission list such that the wells estimated to have the least influence are presented first. This offers users more assistance in assessing which monitoring wells may be the most suitable for future omission and eventual decommissioning. This well influence order is established via a procedure fully documented here and here.
- GW Well Report Functionality: Ability to export the full collection of Well Time Series plots which can include overlaid groundwater and NAPL thickness. See section 6.5 of the user manual – here.
- For GWSDAT R Developers:
- New R package released on CRAN here and on GitHub here.
- New functionality to read in data.frames directly to the GWSDAT R package – see here.
- Beta implementation of online GWSDAT Application Programming Interface (API). This allows users to pass data directly to the online version via URL arguments - see here.
- Updated User Manual: http://gwsdat.net/gwsdat_manual. A fully comprehensive updated description of GWSDAT - including Well Influence Analysis.
- Bug Fixes and Enhancements: Numerous bug fixes and enhancements. For example, support for Windows Meta File image format output for spatial plot - useful for rearranging overlapping well labels. Updated Excel Add-in - more robust to 32 bit versus 64 bit version of Excel.
Background
Introduction
The GroundWater Spatiotemporal Data Analysis Tool (GWSDAT) has been developed by Shell Global Solutions for the analysis of groundwater monitoring data. It is designed to work with simple time-series data for solute concentration and ground water elevation, but can also plot non-aqueous phase liquid (NAPL) thickness if required.
Spatial data is input in the form of well coordinates, and wells can be grouped to separate data from different aquifer units. The software also allows the import of a site basemap in GIS shapefile format. Concentration trend and 2D contour plots generated using GWSDAT can be exported directly to Microsoft PowerPoint and Word to expedite reporting.
Software Architecture
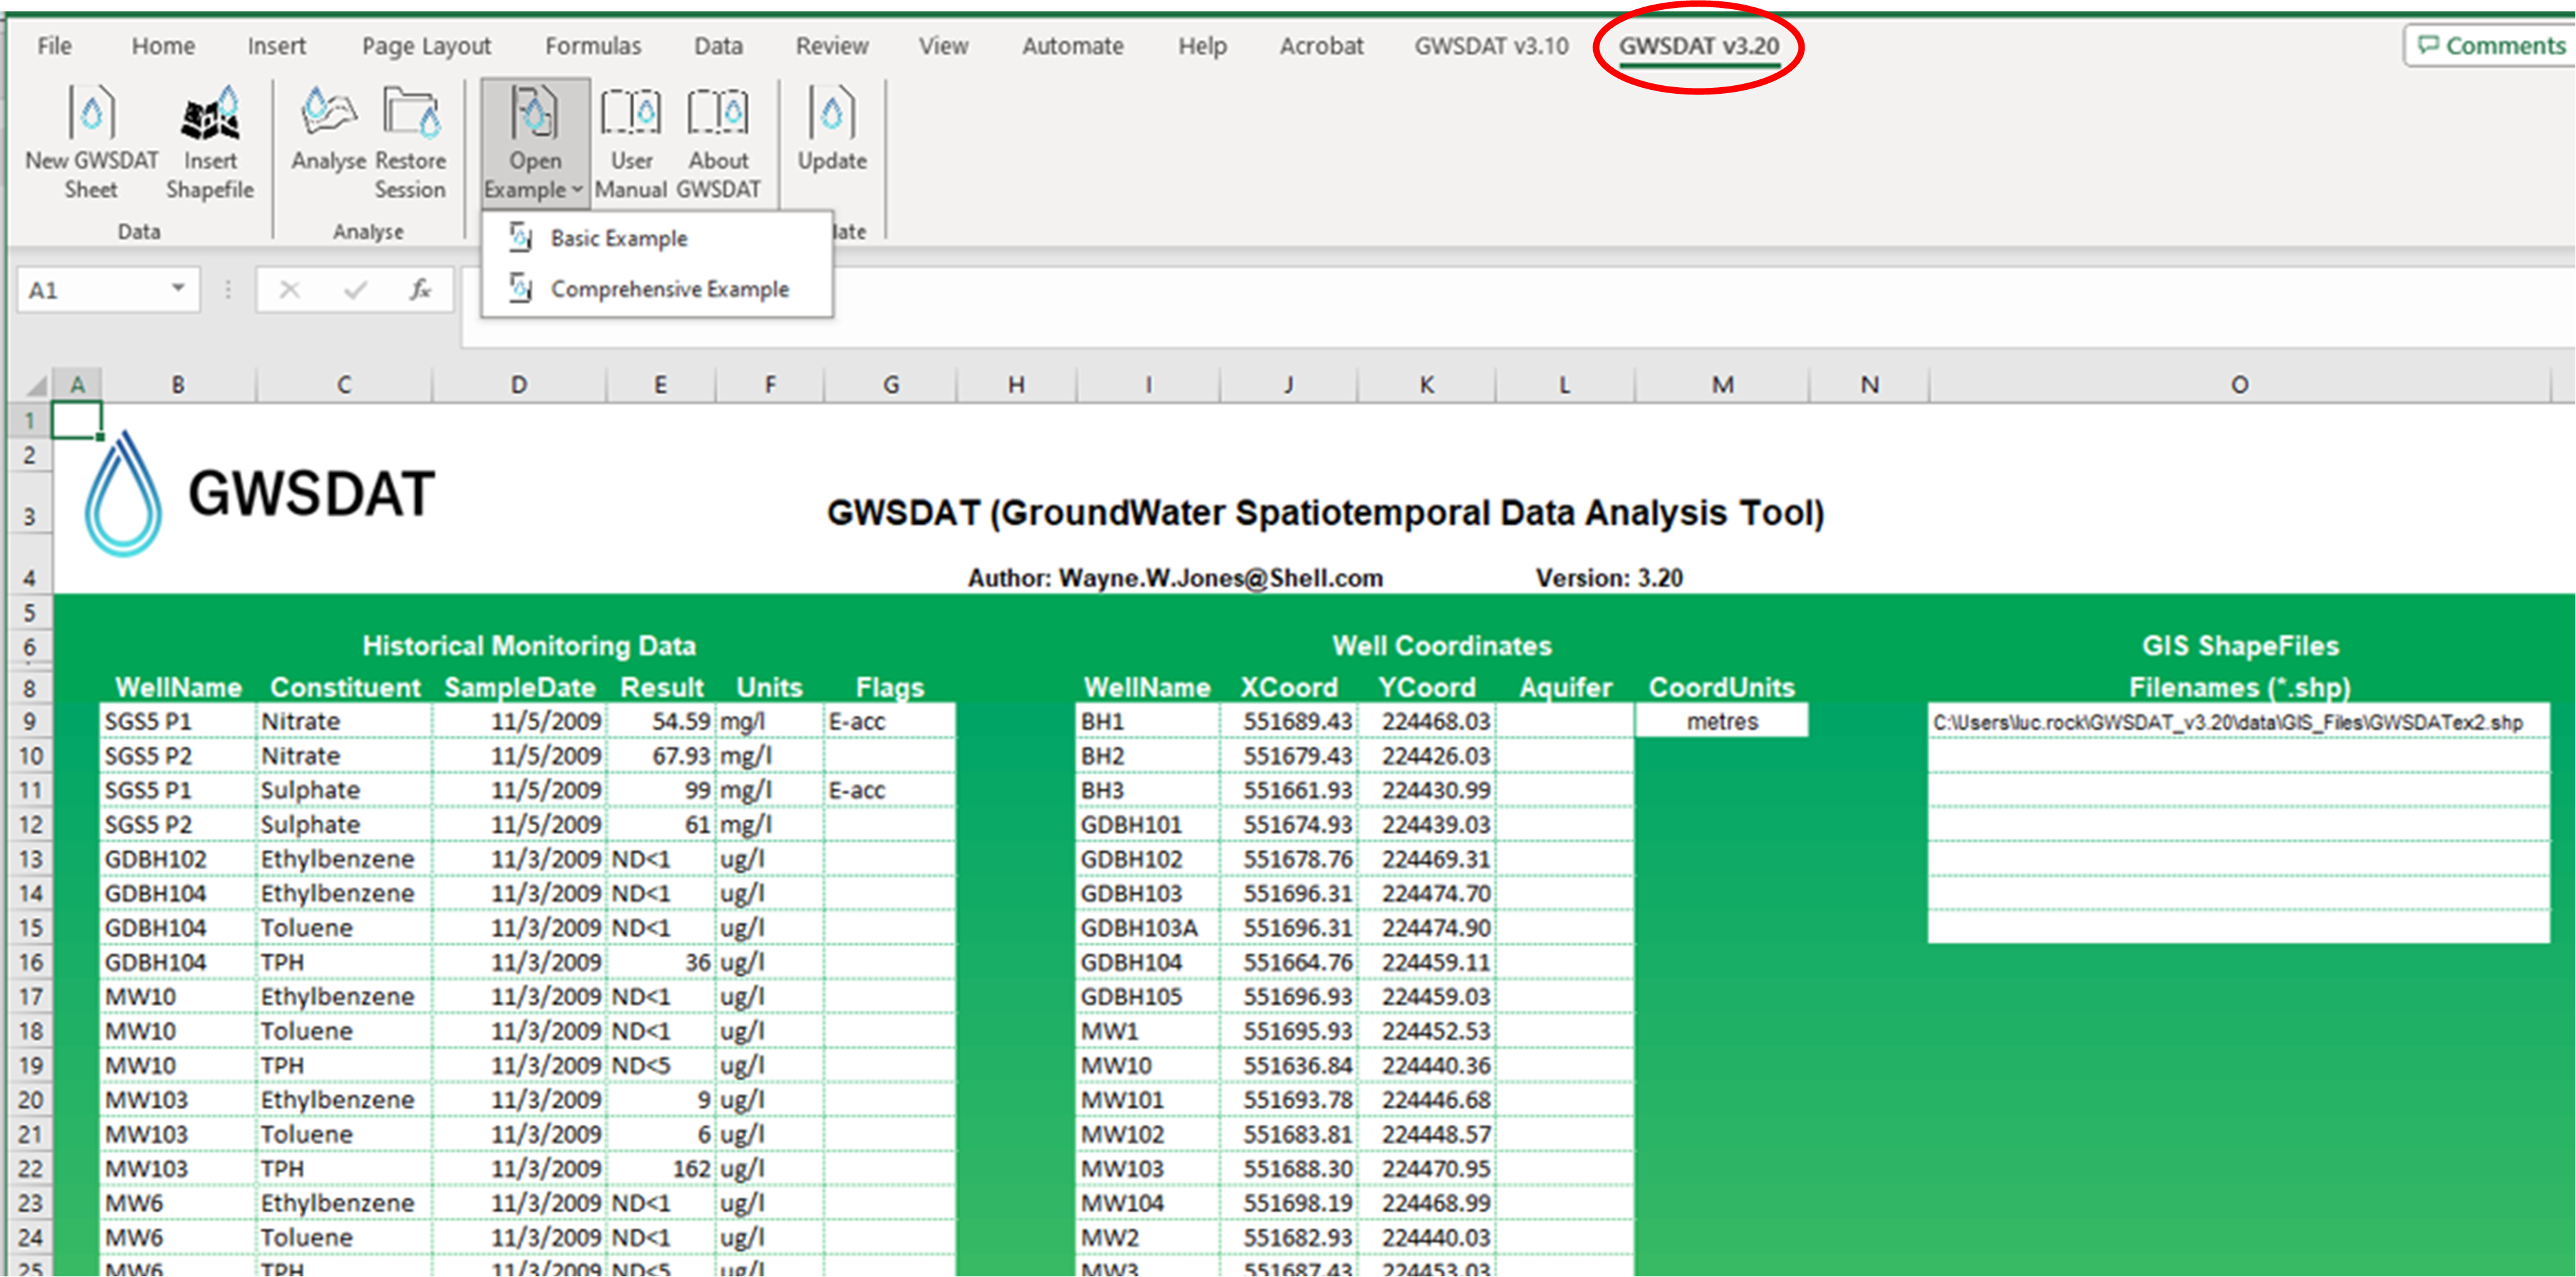
The application is supported for Windows 8 & 10 and the corresponding version of Microsoft Office (including 64-bit operating systems). Data input to GWSDAT is via a standardized Excel spreadsheet and the data analysis and plot functions are accessed through an Excel Add-in application.
The statistical engine used to perform geo-statistical modelling and display graphical output is the open- source statistical programming language R (www.r-project.org). A user manual and two example datasets are provided with the software for training and demonstration purposes.

{multithumb}
Spatiotemporal Data Analysis
 The modelling of solute distribution in groundwater is typically restricted to either the analysis of trends in individual wells or independent fitting of spatial concentration distributions (e.g. by Kriging) to data from monitoring events. Neither of these techniques satisfactorily elucidate the interaction between spatial and temporal components of the data.
GWSDAT applies a spatiotemporal model smoother for a more coherent and smooth interpretation of the interaction in spatial and time-series components of groundwater solute concentrations. A spatiotemporal concentration smoother is fitted for each analyte using a non-parametric regression technique known as Penalised Splines (Eilers and Marx, 1992, 1996).
A Bayesian methodology is used to select the appropriate degree of model smoothness (Evers et al, 2015). The fit of the spatiotemporal algorithm to the monitoring data can be evaluated.
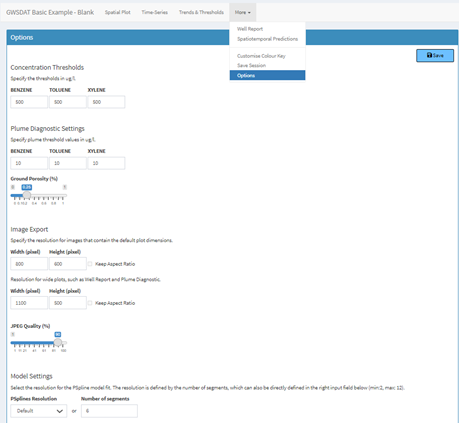
Graphical User Interface
 The GWSDAT graphical user interface (GUI) allows the user to navigate through a groundwater dataset and explore concentration/ groundwater elevation trends in individual wells and across the site.
Several options are available to customize the display and data analysis. Note that plots can also be automatically exported.
{multithumb}
Data Visualisation
GWSDAT includes the following tools for trend visualization and detection:
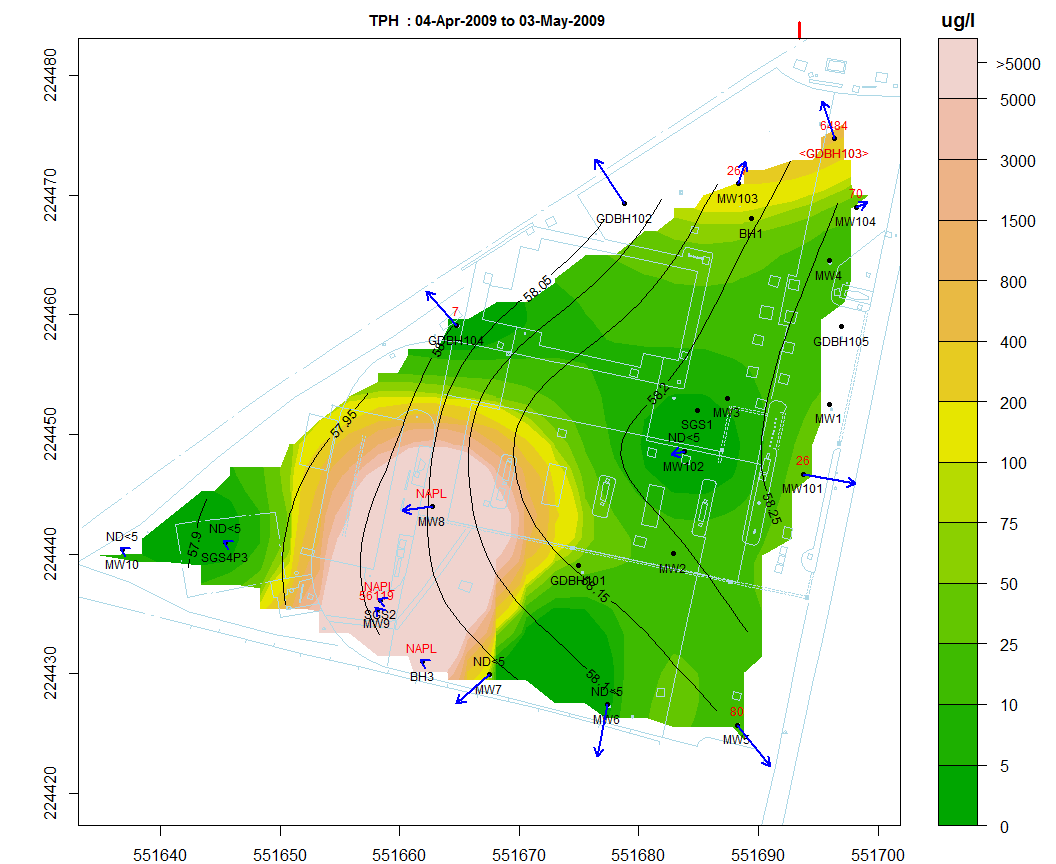
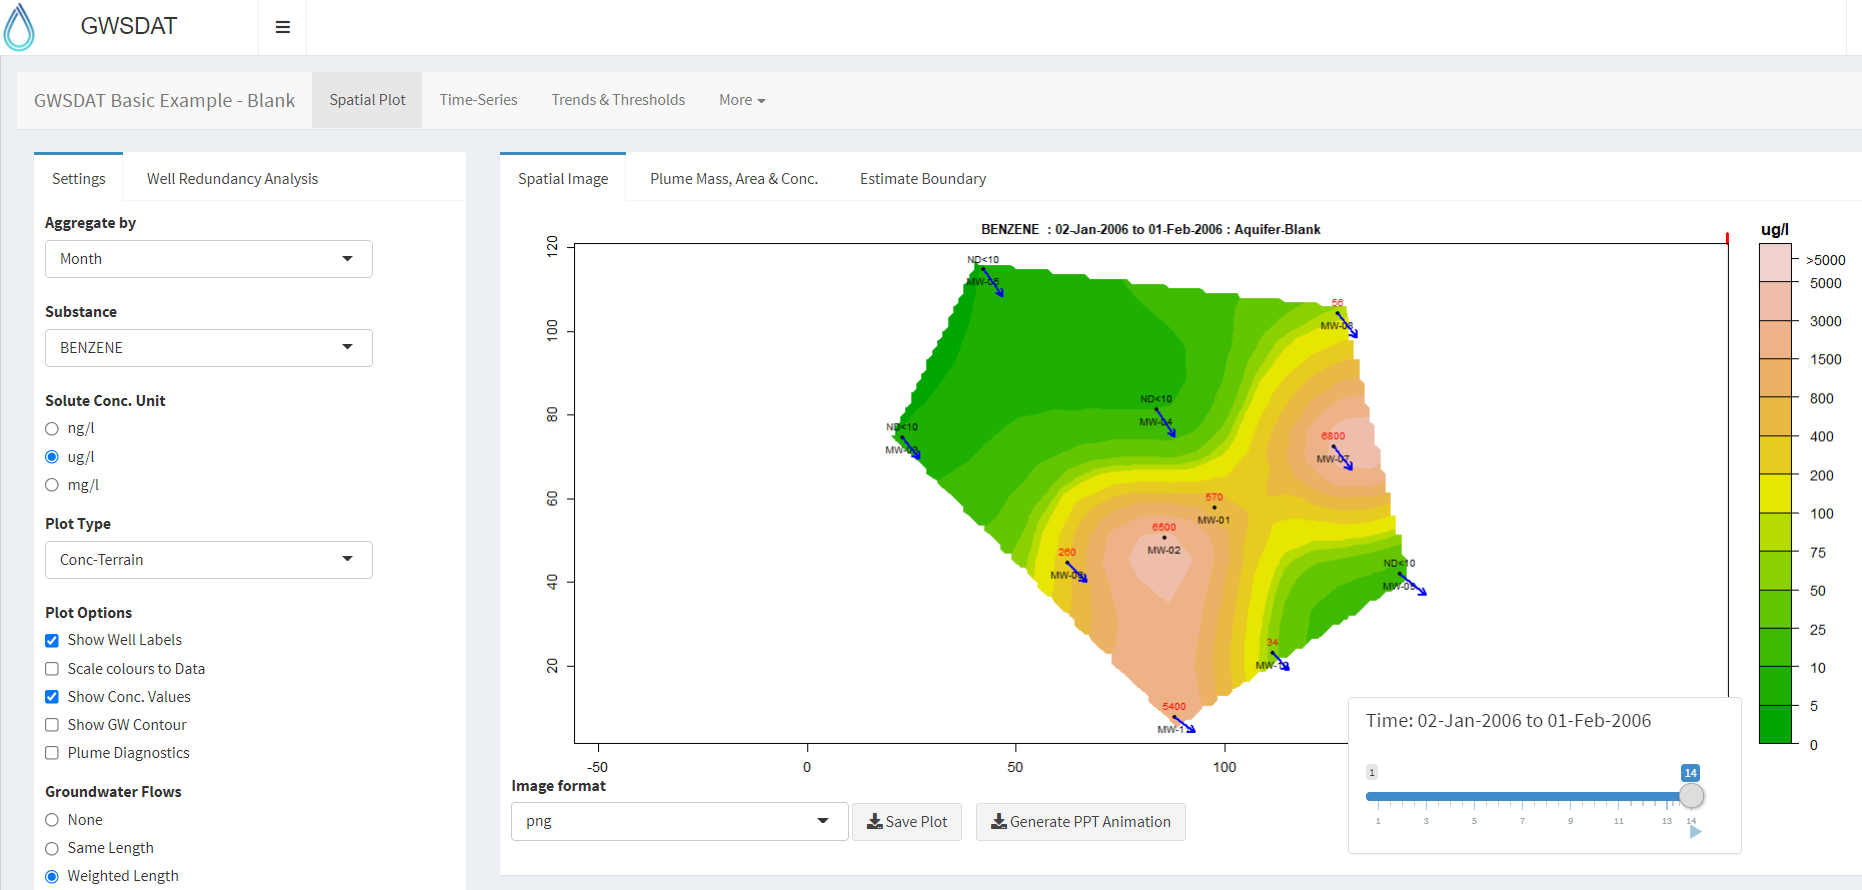
Spatial plot:
For the analysis of spatial trends in solute concentrations, groundwater flow and, if present, NAPL thickness.
Overlaid on this plot are the predictions of the spatiotemporal solute concentration smoother which is a function that simultaneously estimates both the spatial and time series trend in site solute concentrations.
GIS shapefiles can also be overlaid on this plot.
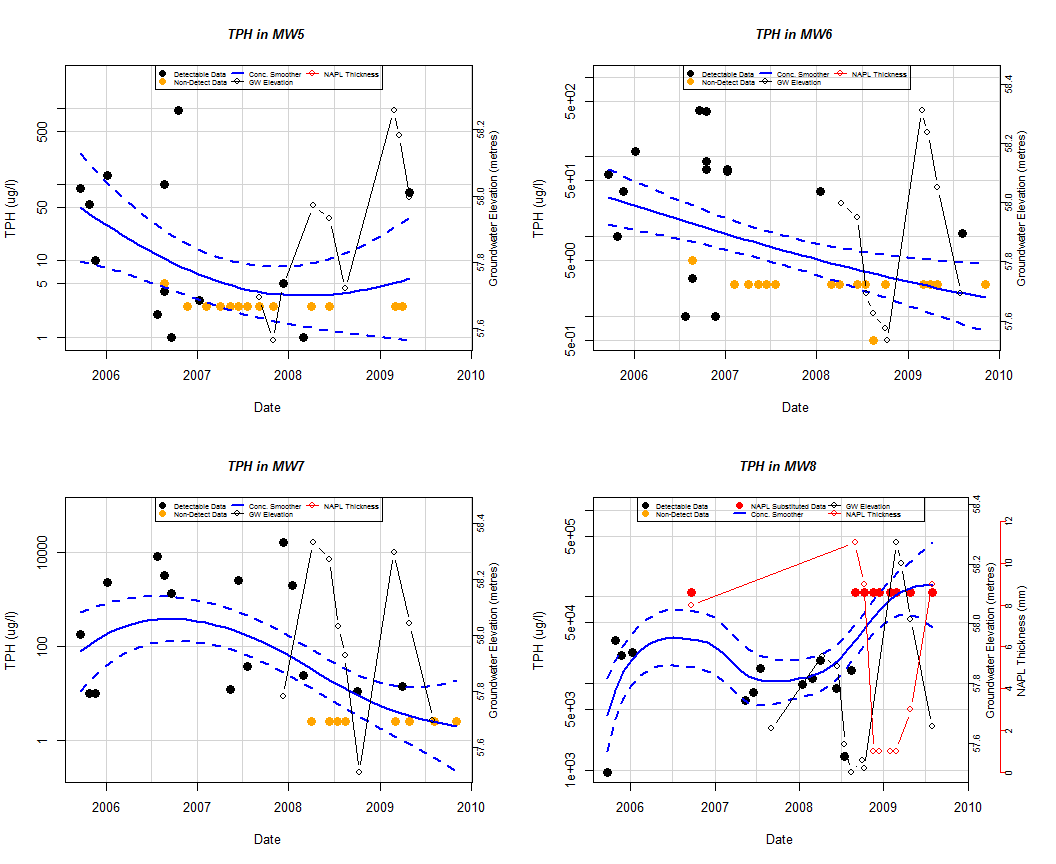
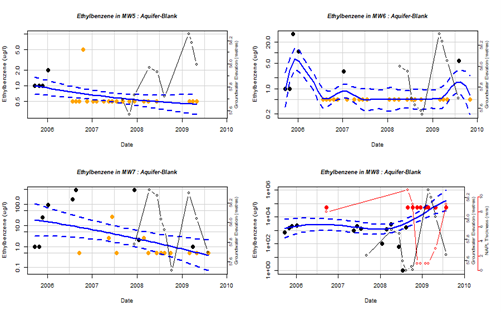
Well Trend plot:
For the investigation of historical time-series trends in solute concentrations, groundwater elevation and, if present, NAPL thickness for individual wells.
Users can overlay a nonparametric smoother which estimates the time-series trend in solute concentration.
The advantage of this nonparametric method is that the trend estimate is not constrained to be monotonic, i.e. the trend can change direction.
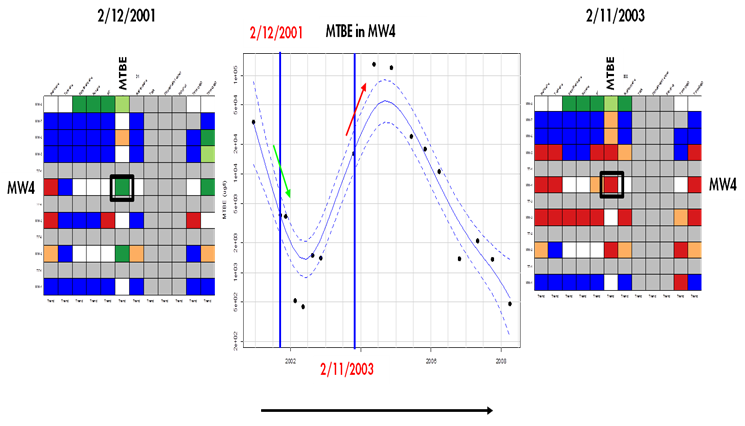
Trend and Threshold Indicator Matrix:
This feature provides a summary of the level and time series trend in solute concentrations at a particular model output interval.
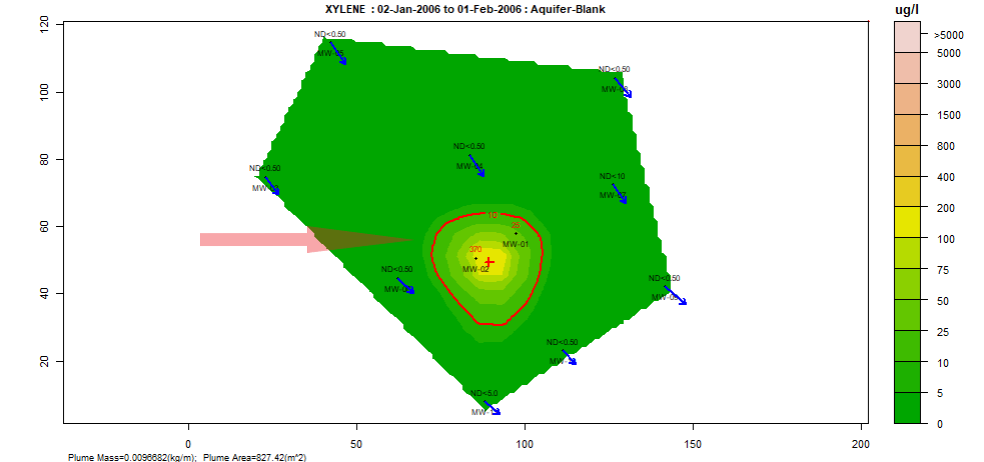
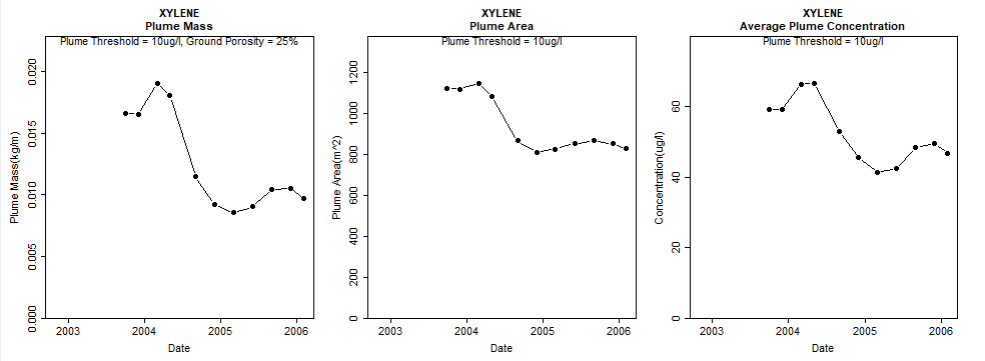
Plume diagnostics plots:
This feature enables the user to calculate and display plume diagnostic quantities (area, mass, concentration) for a delineated plume displayed with a solid red contour line.
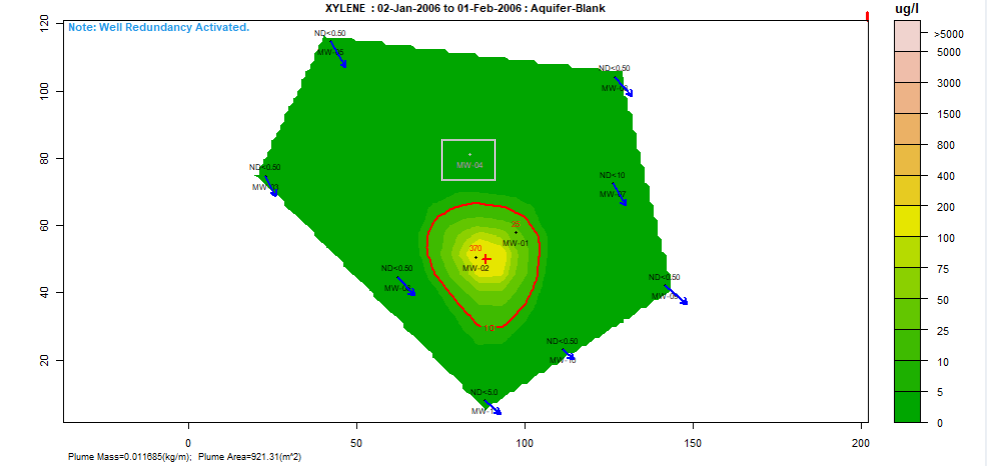
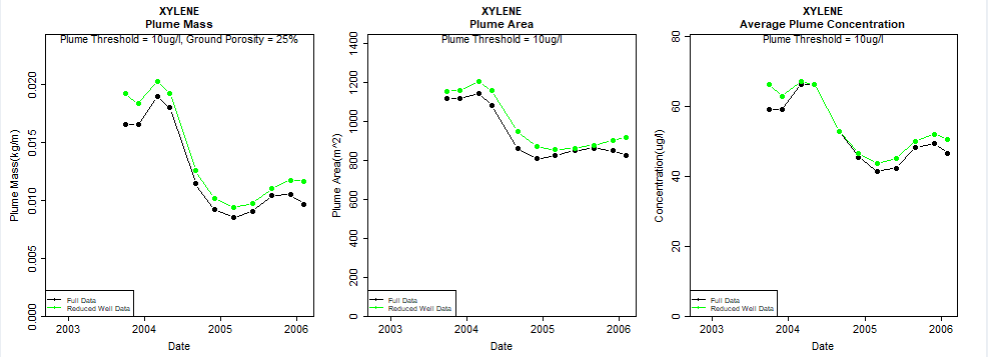
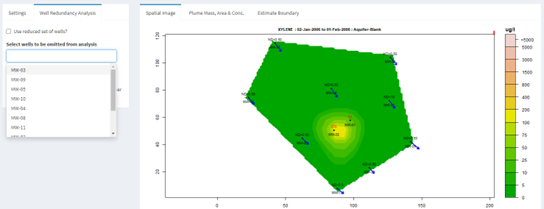
Well redundancy:
This feature enables the user to very conveniently drop a well or a combination of wells from the analysis and investigate the resultant impact.
Installation Instructions
System Requirements: Windows 8 or 10. Microsoft Office versions: 365, 2016, 2013, 2010. You need to be connected to the internet when you install GWSDAT version 3.2.
- Download and install the latest version of the open source statistical application "R" available from: http://cran.r-project.org/bin/windows/base/ . Please accept all default settings during installation. (Users must have administrator access rights to install R).
- Download the GWSDAT_v3.20.zip file from http://gwsdat.net/gwsdat_v3-20/ and unzip to somewhere on your C: Drive which is read/writable, e.g. C:\Users\A.N.Other\GWSDAT.
- Open Excel and install the GWSDAT add-in by choosing: "File" -> "Options" -> "Add-Ins" -> "Go" -> "Browse" and then select "GWSDAT V3.20.xlam" located in the "C:\Users\A.N.Other\GWSDAT_v3.20" folder. To avoid any Excel add-in security issues please ensure that this is a trusted location. See link here for troubleshooting Excel Add-in installation issues.
- A menu called "GWSDAT v3.20" will appear in the EXCEL ribbon (on right side) along the top of the EXCEL window.
Getting started
- To get started with a basic example activate menu by clicking on “GWSDAT v3.20”and then select “Open Example” > select “Basic Example" and then select "Analyse”.
- Note- the first time you run this it may take a while as it needs to download and install some additional R packages.
- To get started with a more complex example activate menu by clicking on “GWSDAT v3.20”and then select “Open Example” > select “Comprehensive Example”, and then select "Analyse”.
{multithumb}
Help and Support
Further details on GWSDAT at www.gwsdat.net
Useful Links and Presentations
GWSDAT is listed in the following ITRC guidance document: Groundwater statistics for Monitoring and Compliance
Case studies: http://gwsdat.net/case-studies/
Article: Groundwater Spatiotemporal Data Analysis Tool: Case Studies, New Features and Future Developments
Article: on benefits of spatiotemporal modelling GWSDAT in Science of Total Environment.
Article: on GWSDAT in Science Direct
Article: "Analyzing Groundwater Quality Data and Contamination Plumes with GWSDAT" in Groundwater
Supporting information for the above Groundwater article:
{multithumb}
Acknowledgements
The authors gratefully acknowledge those people who have contributed their knowledge and time to the development of GWSDAT.
The authors wish to express their gratitude to Craig Alexander, Adrian Bowman, Ludger Evers, Marnie Low, Claire Miller, Daniel Molinari and Peter Radvanyi from the department of Statistics, University of Glasgow, for their invaluable contributions to the development of the spatiotemporal algorithm.
Thanks also to Ewan Mercer from the University of Glasgow for his assistance in the development of the GWSDAT user interface.
We acknowledge and thank the R project for Statistical Computing and all its contributors without which this project would not have been possible.
A big thank you to Shell's worldwide environmental consultants for assistance in evaluating and testing the earlier versions of GWSDAT.
Thanks also to the Shell Year in Industry students who spent a great deal of time testing GWSDAT and making suggestions for improvements.
We thank both current and former colleagues including Matthew Lahvis, Jonathan Smith, George Devaull, Dan Walsh, Curtis Stanley, Marco Giannitrapani and Philip Jonathan for their support, vision and advocacy of GWSDAT.
References
-
Bowman and Azzalini, 1997. Applied Smoothing Techniques for Data Analysis: the Kernel Approach with S-Plus Illustrations. Oxford University Press, Oxford, 1997.
-
Bowman and Azzalini. sm: Smoothing methods for nonparametric regression and density estimation. R package, www.stats.gla.ac.uk/~adrian/sm
-
Eilers and Marx, 1992. Generalized Linear Models with P-Splines in Advances in GLIM and Statistical Modelling (L.Fahrmeir et al.eds.). Springer, New York.
-
Eilers and Marx, 1996. Flexible smoothing with b-splines and penalties. Statistical Science 11, 89–121.
-
Evers et al., 2015. Efficient and automatic methods for flexible regression on spatiotemporal data, with applications to groundwater monitoring, Environmetrics (open access), 26(6), 431-441.
-
Jones, et al., 2014. A software tool for the spatiotemporal analysis and reporting of groundwater monitoring data (open access), Environmental Modelling & Software, 55, 242-249.
-
Jones, et al., 2015. Analyzing Groundwater Quality Data and Contamination Plumes with GWSDAT (open access), Groundwater, 53 (4), 513-514.
- Jones, W.R., Rock, L., Wesch, A., Marzusch, E. and Low, M. (2022), Groundwater Spatiotemporal Data Analysis Tool: Case Studies, New Features and Future Developments. Groundwater Monit R, 42: 14-22. https://doi.org/10.1111/gwmr.12522
-
McLean et al., 2019, Statistical modelling of groundwater contamination monitoring data: A comparison of spatial and spatiotemporal methods, Science of The Total Environment (open access), 652, 1339-1346.
-
R Development Core Team. R: A Language and Environment for Statistical Computing. R Foundation for Statistical Computing, Vienna, Austria, 2-008. ISBN 3-900051-07-0, http://www.r-project.org
{multithumb}
GWSDAT v3.2 now released!
Click here for a list of important updates.
What is GWSDAT?
GWSDAT is an open source, user-friendly, software application for the visualisation and interpretation of groundwater monitoring data. It also enables to work with other types of monitoring data collected over time and space (e.g. soil gas concentrations).
Key functionalities of tool:
- Trend analyses
- Data smoothing
- Spatiotemporal smoothing
- Determination of contamination plume characteristics
- Well redundancy analysis
- Automatic report generation tools based on user input.
Business Benefits
GWSDAT, through improved risk-based decision making and response, adds value in several different ways:
- Early identification of increasing trends or off-site migration.
- Evaluation of groundwater monitoring trends over time and space (i.e., holistic plume evaluation).
- Nonparametric statistical and uncertainty analyses to assess highly variable groundwater data.
- Reduction in the number of sites in long-term monitoring or active remediation through simple, visual demonstrations of groundwater data and trends.
- More efficient evaluation and reporting of groundwater monitoring trends via simple, standardised plots and tables created at the ‘click of a mouse.’
- Well Redundancy Analysis functionality to identify potential optimization measures with regards to monitoring well network sampling locations.
GWSDAT V3.2 updates
- Well Influence Analysis: Building on the existing well redundancy analysis feature, GWSDAT now provides an ordered well omission list such that the wells estimated to have the least influence are presented first. This offers users more assistance in assessing which monitoring wells may be the most suitable for future omission and eventual decommissioning. This well influence order is established via a procedure fully documented here and here.
- GW Well Report Functionality: Ability to export the full collection of Well Time Series plots which can include overlaid groundwater and NAPL thickness. See section 6.5 of the user manual – here.
- For GWSDAT R Developers:
- New R package released on CRAN here and on GitHub here.
- New functionality to read in data.frames directly to the GWSDAT R package – see here.
- Beta implementation of online GWSDAT Application Programming Interface (API). This allows users to pass data directly to the online version via URL arguments - see here.
- Updated User Manual: http://gwsdat.net/gwsdat_manual. A fully comprehensive updated description of GWSDAT - including Well Influence Analysis.
- Bug Fixes and Enhancements: Numerous bug fixes and enhancements. For example, support for Windows Meta File image format output for spatial plot - useful for rearranging overlapping well labels. Updated Excel Add-in - more robust to 32 bit versus 64 bit version of Excel.
Background
Introduction
The GroundWater Spatiotemporal Data Analysis Tool (GWSDAT) has been developed by Shell Global Solutions for the analysis of groundwater monitoring data. It is designed to work with simple time-series data for solute concentration and ground water elevation, but can also plot non-aqueous phase liquid (NAPL) thickness if required.
Spatial data is input in the form of well coordinates, and wells can be grouped to separate data from different aquifer units. The software also allows the import of a site basemap in GIS shapefile format. Concentration trend and 2D contour plots generated using GWSDAT can be exported directly to Microsoft PowerPoint and Word to expedite reporting.
Software Architecture
The application is supported for Windows 8 & 10 and the corresponding version of Microsoft Office (including 64-bit operating systems). Data input to GWSDAT is via a standardized Excel spreadsheet and the data analysis and plot functions are accessed through an Excel Add-in application.
The statistical engine used to perform geo-statistical modelling and display graphical output is the open- source statistical programming language R (www.r-project.org). A user manual and two example datasets are provided with the software for training and demonstration purposes.
{multithumb}
Spatiotemporal Data Analysis
The modelling of solute distribution in groundwater is typically restricted to either the analysis of trends in individual wells or independent fitting of spatial concentration distributions (e.g. by Kriging) to data from monitoring events. Neither of these techniques satisfactorily elucidate the interaction between spatial and temporal components of the data.
GWSDAT applies a spatiotemporal model smoother for a more coherent and smooth interpretation of the interaction in spatial and time-series components of groundwater solute concentrations. A spatiotemporal concentration smoother is fitted for each analyte using a non-parametric regression technique known as Penalised Splines (Eilers and Marx, 1992, 1996).
A Bayesian methodology is used to select the appropriate degree of model smoothness (Evers et al, 2015). The fit of the spatiotemporal algorithm to the monitoring data can be evaluated.
Graphical User Interface
The GWSDAT graphical user interface (GUI) allows the user to navigate through a groundwater dataset and explore concentration/ groundwater elevation trends in individual wells and across the site.
Several options are available to customize the display and data analysis. Note that plots can also be automatically exported.
{multithumb}
Data Visualisation
GWSDAT includes the following tools for trend visualization and detection:
Spatial plot:
For the analysis of spatial trends in solute concentrations, groundwater flow and, if present, NAPL thickness.
Overlaid on this plot are the predictions of the spatiotemporal solute concentration smoother which is a function that simultaneously estimates both the spatial and time series trend in site solute concentrations.
GIS shapefiles can also be overlaid on this plot.
Well Trend plot:
For the investigation of historical time-series trends in solute concentrations, groundwater elevation and, if present, NAPL thickness for individual wells.
Users can overlay a nonparametric smoother which estimates the time-series trend in solute concentration.
The advantage of this nonparametric method is that the trend estimate is not constrained to be monotonic, i.e. the trend can change direction.
Trend and Threshold Indicator Matrix:
This feature provides a summary of the level and time series trend in solute concentrations at a particular model output interval.
Plume diagnostics plots:
This feature enables the user to calculate and display plume diagnostic quantities (area, mass, concentration) for a delineated plume displayed with a solid red contour line.
Well redundancy:
This feature enables the user to very conveniently drop a well or a combination of wells from the analysis and investigate the resultant impact.
Installation Instructions
System Requirements: Windows 8 or 10. Microsoft Office versions: 365, 2016, 2013, 2010. You need to be connected to the internet when you install GWSDAT version 3.2.
- Download and install the latest version of the open source statistical application "R" available from: http://cran.r-project.org/bin/windows/base/ . Please accept all default settings during installation. (Users must have administrator access rights to install R).
- Download the GWSDAT_v3.20.zip file from http://gwsdat.net/gwsdat_v3-20/ and unzip to somewhere on your C: Drive which is read/writable, e.g. C:\Users\A.N.Other\GWSDAT.
- Open Excel and install the GWSDAT add-in by choosing: "File" -> "Options" -> "Add-Ins" -> "Go" -> "Browse" and then select "GWSDAT V3.20.xlam" located in the "C:\Users\A.N.Other\GWSDAT_v3.20" folder. To avoid any Excel add-in security issues please ensure that this is a trusted location. See link here for troubleshooting Excel Add-in installation issues.
- A menu called "GWSDAT v3.20" will appear in the EXCEL ribbon (on right side) along the top of the EXCEL window.
Getting started
- To get started with a basic example activate menu by clicking on “GWSDAT v3.20”and then select “Open Example” > select “Basic Example" and then select "Analyse”.
- Note- the first time you run this it may take a while as it needs to download and install some additional R packages.
- To get started with a more complex example activate menu by clicking on “GWSDAT v3.20”and then select “Open Example” > select “Comprehensive Example”, and then select "Analyse”.
{multithumb}
Help and Support
Further details on GWSDAT at www.gwsdat.net
Useful Links and Presentations
GWSDAT is listed in the following ITRC guidance document: Groundwater statistics for Monitoring and Compliance
Case studies: http://gwsdat.net/case-studies/
Article: Groundwater Spatiotemporal Data Analysis Tool: Case Studies, New Features and Future Developments
Article: on benefits of spatiotemporal modelling GWSDAT in Science of Total Environment.
Article: on GWSDAT in Science Direct
Article: "Analyzing Groundwater Quality Data and Contamination Plumes with GWSDAT" in Groundwater
Supporting information for the above Groundwater article:
{multithumb}
Acknowledgements
The authors gratefully acknowledge those people who have contributed their knowledge and time to the development of GWSDAT.
The authors wish to express their gratitude to Craig Alexander, Adrian Bowman, Ludger Evers, Marnie Low, Claire Miller, Daniel Molinari and Peter Radvanyi from the department of Statistics, University of Glasgow, for their invaluable contributions to the development of the spatiotemporal algorithm.
Thanks also to Ewan Mercer from the University of Glasgow for his assistance in the development of the GWSDAT user interface.
We acknowledge and thank the R project for Statistical Computing and all its contributors without which this project would not have been possible.
A big thank you to Shell's worldwide environmental consultants for assistance in evaluating and testing the earlier versions of GWSDAT.
Thanks also to the Shell Year in Industry students who spent a great deal of time testing GWSDAT and making suggestions for improvements.
We thank both current and former colleagues including Matthew Lahvis, Jonathan Smith, George Devaull, Dan Walsh, Curtis Stanley, Marco Giannitrapani and Philip Jonathan for their support, vision and advocacy of GWSDAT.
References
-
Bowman and Azzalini, 1997. Applied Smoothing Techniques for Data Analysis: the Kernel Approach with S-Plus Illustrations. Oxford University Press, Oxford, 1997.
-
Bowman and Azzalini. sm: Smoothing methods for nonparametric regression and density estimation. R package, www.stats.gla.ac.uk/~adrian/sm
-
Eilers and Marx, 1992. Generalized Linear Models with P-Splines in Advances in GLIM and Statistical Modelling (L.Fahrmeir et al.eds.). Springer, New York.
-
Eilers and Marx, 1996. Flexible smoothing with b-splines and penalties. Statistical Science 11, 89–121.
-
Evers et al., 2015. Efficient and automatic methods for flexible regression on spatiotemporal data, with applications to groundwater monitoring, Environmetrics (open access), 26(6), 431-441.
-
Jones, et al., 2014. A software tool for the spatiotemporal analysis and reporting of groundwater monitoring data (open access), Environmental Modelling & Software, 55, 242-249.
-
Jones, et al., 2015. Analyzing Groundwater Quality Data and Contamination Plumes with GWSDAT (open access), Groundwater, 53 (4), 513-514.
- Jones, W.R., Rock, L., Wesch, A., Marzusch, E. and Low, M. (2022), Groundwater Spatiotemporal Data Analysis Tool: Case Studies, New Features and Future Developments. Groundwater Monit R, 42: 14-22. https://doi.org/10.1111/gwmr.12522
-
McLean et al., 2019, Statistical modelling of groundwater contamination monitoring data: A comparison of spatial and spatiotemporal methods, Science of The Total Environment (open access), 652, 1339-1346.
-
R Development Core Team. R: A Language and Environment for Statistical Computing. R Foundation for Statistical Computing, Vienna, Austria, 2-008. ISBN 3-900051-07-0, http://www.r-project.org